
A guided sample ancestry report
Explore the story, proportions, statistical fit, and caveats you can expect from an Ancestrify qpAdm report—using realistic but entirely fabricated data.
Executive summary
Sample profile at a glance
Sample profile A-1042 is compatible with a four-source model led by Aegean Bronze Age ancestry, followed by western steppe, Anatolian farmer, and Caucasus hunter-gatherer-related sources. The strongest continuity appears in southeast Europe, while the timeline shows how older ancestral layers recombine in later periods.
Aegean Bronze Age
38.4% in this model
Compatible
qpAdm p-value 0.184
4 eras
Neolithic to Medieval
Illustrative source composition
Aegean Bronze Age
38.4%
Western Steppe pastoralist
27.1%
Anatolian Neolithic farmer
21.6%
Caucasus hunter-gatherer
12.9%
Explore the timeline
See how the model changes across eras
Choose a period to compare the sample against populations that lived at a similar time depth. Percentages describe this tested model, not fixed ethnic identities.
Steppe ancestry arrives and recombines
This model shows a strong Aegean farmer-related base alongside ancestry associated with western steppe pastoralists and a smaller Caucasus-related signal.
Population proportions
Aegean Bronze Age
43.2%
± 2.6%Western Steppe pastoralist
32.6%
± 2.9%Anatolian Neolithic farmer
15.4%
± 2.4%Caucasus hunter-gatherer
8.8%
± 1.9%
The ± values are standard errors: an honest view of how much each estimate can move within this model. Era models are independent and should not be added together.
Geography & storytelling
See the result in context
Completed reports connect the statistical model to geography and turn the era-by-era story into an optional, shareable ancestry film.
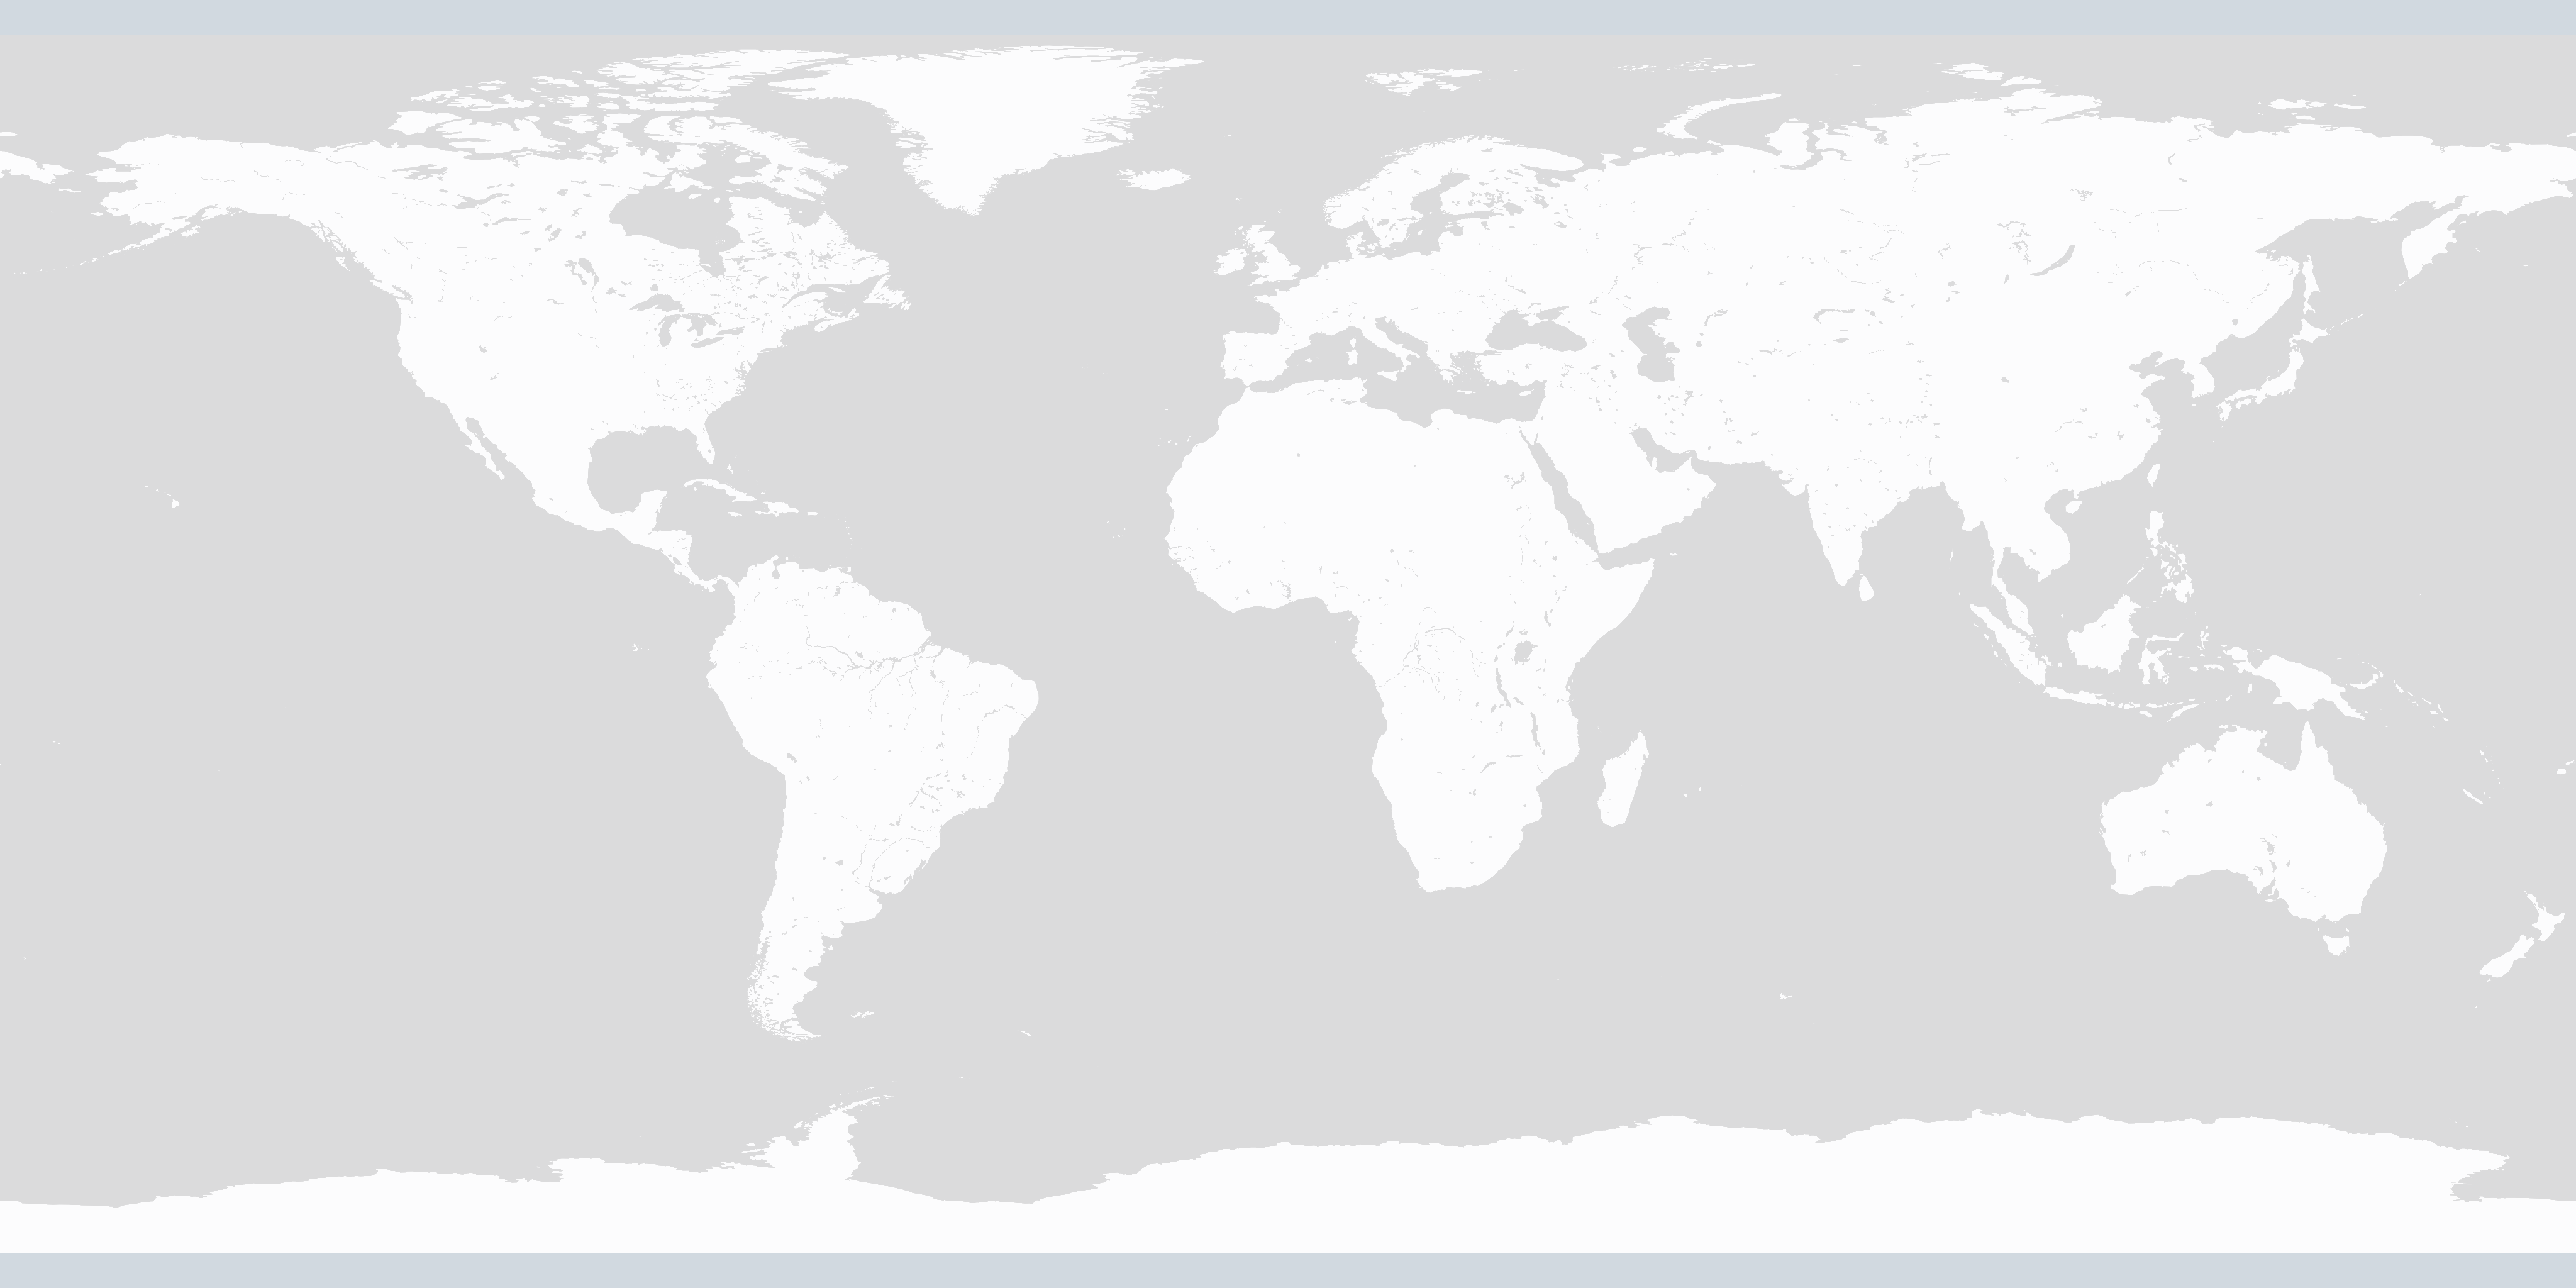
Where this sample model points
The profile’s strongest signal sits around the Aegean and Adriatic, with deeper ancestral links extending toward the Pontic–Caspian Steppe, Anatolia, and the Caucasus. The map is contextual—not a claim that ancestors lived at a precise pin.
Aegean & Adriatic
Primary continuity signalPontic–Caspian Steppe
Bronze Age source signalAnatolia & Caucasus
Early farmer and CHG layers
Your ancestry across the ages
SAMPLE A-10424 eras · 12 populations
A shareable ancestry film
Completed reports can turn your results into a vertical, era-by-era film designed for mobile viewing and sharing. Your film uses the same populations and uncertainty context as the written report.
This is a lightweight poster preview; no sample video or customer media is loaded.
Confidence, not certainty
How well does this model fit?
qpAdm tests whether the proposed sources are statistically compatible with the sample and outgroups. Here, a p-value of 0.184 is above the 0.05 rejection threshold, so the model is not rejected by the test.
That does not prove this is the only—or “true”—historical explanation. It means the model is a plausible fit worth interpreting alongside archaeology, geography, standard errors, and alternative models.
Compatible four-source model
0.184
p-value201,483
SNPs13
Outgroups4
SourcesNot rejected: 0.184 is above the 0.05 threshold
This supports compatibility, not uniqueness or historical certainty.Methodology
From DNA file to an interpretable model
Compare
Your autosomal DNA is compared with curated, quality-controlled ancient reference samples grouped by date and archaeological context.
Test
Candidate source combinations are tested with qpAdm. Models that fail statistical checks are rejected rather than forced into a neat answer.
Interpret
Compatible models are presented by era with proportions, standard errors, fit statistics, and context so you can see both the signal and its limits.
Important caveats
- Ancient populations are analytical proxies, not modern ethnic labels.
- Results depend on the available reference samples and their coverage.
- Several different models can be statistically compatible with the same DNA.
- This service is for ancestry research, not medical or diagnostic use.
Ready to explore your own ancestry?
Compare qpAdm and G25, see exactly what each analysis includes, and choose the method that fits your data and research goals.
Choose your analysis