
Global259 min
Free G25 Admix: a free Global25 admixture report for your coordinates
Have Global25 coordinates? Get a free G25 Admix report: admixture per era, closest populations, notable matches. Free once per account, nothing is published.

Articles
26 articles on Admixture, ancient-DNA research written up for readers who want the evidence, not just the headline.
Admixture tools decompose a genome or a coordinate into percentage contributions from a fixed set of components or sources. GEDmatch's classic calculators, academic ADMIXTURE plots and Global25 mixture fits are all versions of the same idea with very different guarantees. None of them is a test, all of them always return percentages, and the calculator you choose shapes the answer more than the arithmetic does.
The articles here explain the major calculators by name (Eurogenes K13 and K36, Dodecad, HarappaWorld), what an Oracle distance is, why calculators disagree with each other and with testing companies, how accurate any of this can be, and when a formal method like qpAdm is worth the step up.
Run the free Global25 admixture calculatorsHave Global25 coordinates? Get a free G25 Admix report: admixture per era, closest populations, notable matches. Free once per account, nothing is published.

ADMIXTURE and admixture calculators describe structure and always return percentages; qpAdm tests an explicit model and can reject it. What each estimates, why papers run both, and when qpAdm is worth paying for.

A Global25 model and a testing company's ethnicity estimate answer different questions with different references and different time depths. What each is actually computing, and which to trust for which claim.

Every admixture calculator — GEDmatch's classics, Global25 fits, testing-company estimates — is an optimiser that cannot say no. How the three families work, what the percentages mean, and the questions a calculator can and cannot answer.

Which GEDmatch admixture project to run for your background, what each calculator's components mean, why the projects disagree with each other, and what has aged since 2012–2016.

There is no single best admixture calculator — there is a best one per question. An honest decision guide across GEDmatch's classics, Global25 tools and formal methods, from someone who builds one of them.

Accuracy has three different meanings for an ancestry calculator, and the tools do well on exactly one of them. Where percentages are trustworthy, where they are noise, and how to tell which regime you are in.

The same genome scores 44% North European in one calculator and 51% in another. Component anchoring, reference panels, the calculator effect and K explain the spread — and none of the numbers is 'the real one'.

Oracle ranks reference populations by how closely their calculator percentages match yours — not by shared DNA. How the distance is computed, what single and mixed modes tell you, and the misreadings to avoid.

The thirteen K13 components, what North Atlantic, East Med and West Asian are anchored to, who the calculator works best for, how to read the Oracle — and the caveats that come with a 2012-era tool.

What the 36-component Eurogenes calculator can genuinely show, why its regional labels invite over-reading, what a K36 heat map is actually plotting, and when a distance ranking answers the question better.

The original admixture project's most-used calculator: what the twelve K12b components are anchored to, what Gedrosia and Caucasus mean in modern ancient-DNA terms, and how to read a K12b breakdown.

What HarappaWorld's S-Indian, Baloch and NE-Euro components are anchored to, why it remains the reference calculator for South Asian ancestry, and how its 2012 categories map onto what ancient DNA later proved.

The program behind the bar plots in population-genetics papers: how ADMIXTURE estimates K components jointly from all samples, supervised versus unsupervised runs, choosing K, and why hobbyist calculators are its frozen shadows.

A calculator against modern populations answers 'who do I resemble today'; one against dated ancient samples answers 'which deep ancestries formed me'. Mixing up the two produces the classic misreadings.

A step-by-step qpAdm tutorial: check your raw file, merge it into AADR v66, choose sources and outgroups, run it in the browser or in R, and read the result.

What ancient genomes say about Jewish ancestry, why a consumer 'Ashkenazi Jewish' percentage is circular and cannot fail, what a qpAdm model with a p-value measures instead, its limits for a Jewish genome, and a checklist before you buy.

What every number in the model record of an Ancestrify qpAdm report means, from chi-square, degrees of freedom and f4 rank to 95% confidence intervals, what the analyst checked before publishing, and a worked example read line by line, with the R code to rerun it.

A plain reading guide to the three numbers in every qpAdm result — what the p-value tests, what a standard error bounds, what a Z-score rules out — with worked examples and the mistakes that make a passing model wrong.

A step-by-step Vahaduo tutorial: where to paste your Global25 coordinates, how the Distance, Single, Multi and PCA tabs work, how to build a source panel, and how to read a fit distance without over-reading it.

How to run qpAdm on your own genome in the Ancestry Workbench: preparing a kit, choosing sources and outgroups, reading a rejection, running a rotation as a batch of real fits, scanning Fst distance, and downloading the EIGENSTRAT bundle to reproduce everything on your own machine.

Why a standard Global25 calculator can describe a population well and one person badly, how our analyst builds a calculator around your own coordinates for every Ancestry Map, and what your report shows you.

Global25 fits your coordinate to a mixture and always returns percentages. qpAdm tests a model against allele-frequency statistics and can reject it. A practical comparison of when each one is the right instrument.

What the 25 numbers mean, why scaled and unscaled forms must never be mixed, how a closest-population ranking is computed, what a fit distance does and does not tell you, and the failure modes that make confident results wrong.

Ten genomes from a Himalayan cave reveal a population that was half Tibetan-related and half North Indian-related, mixing from about 2800 years ago.
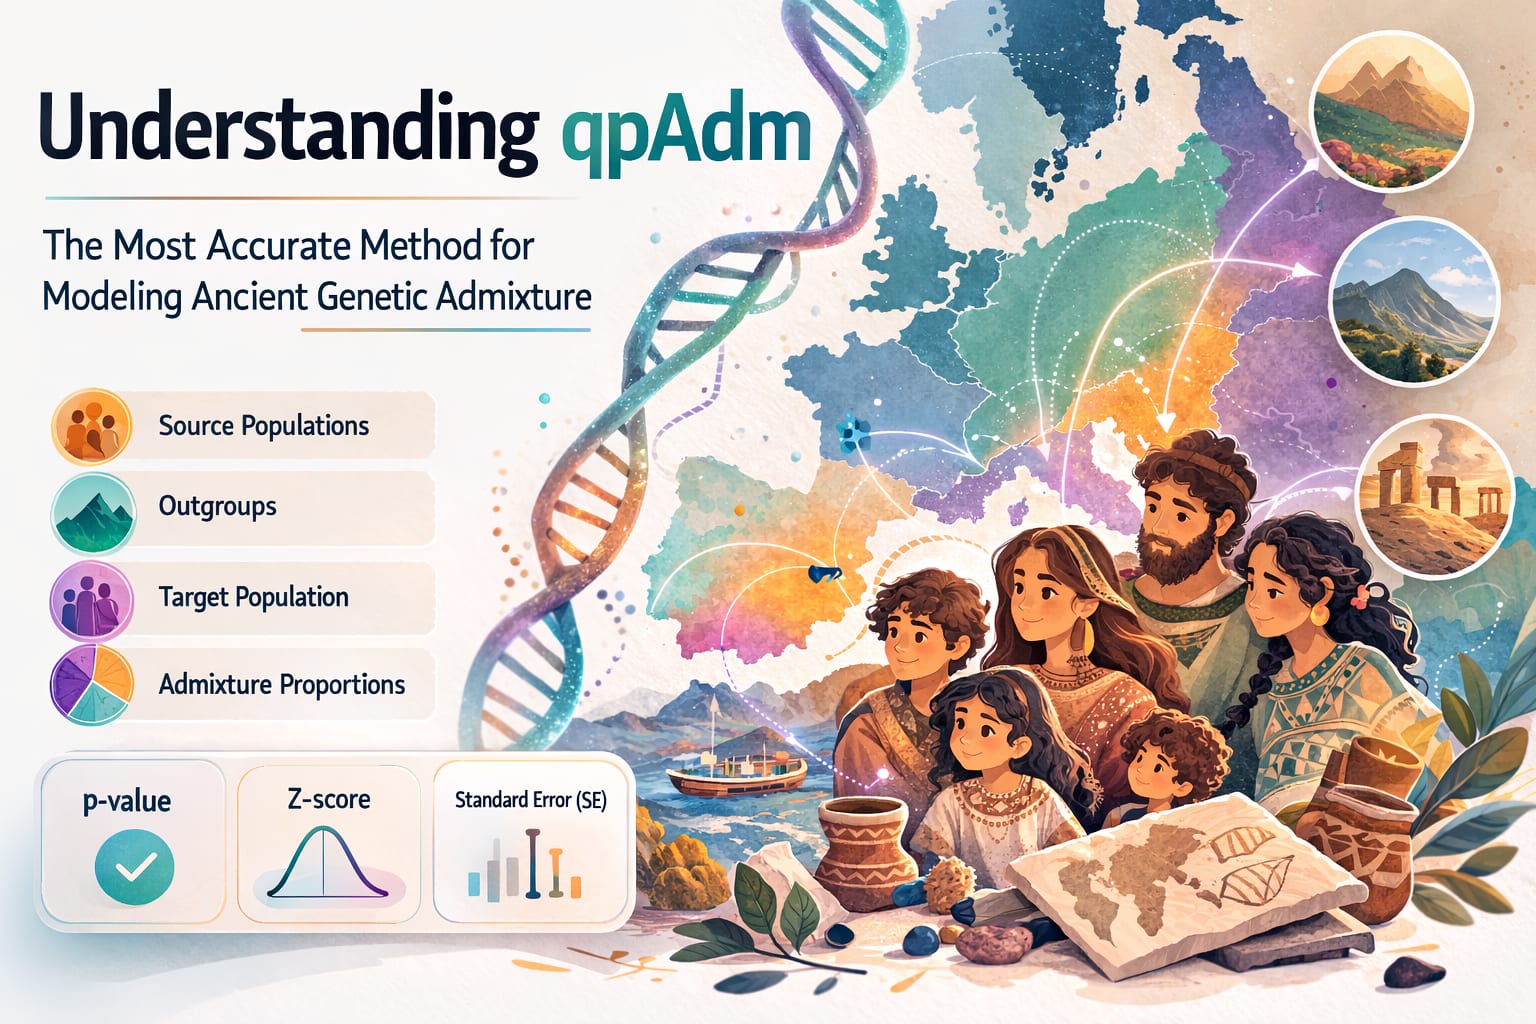
The method, for readers who want the maths: what qpAdm computes, what the p-value, standard error and z-score each mean, why outgroup choice decides whether a model is worth anything, and how to read a rejection — with a worked example.