
Global259 min
Free G25 Admix: a free Global25 admixture report for your coordinates
Have Global25 coordinates? Get a free G25 Admix report: admixture per era, closest populations, notable matches. Free once per account, nothing is published.

Articles
25 articles on Global25, ancient-DNA research written up for readers who want the evidence, not just the headline.
Global25 (G25) is the coordinate system the ancestry community has settled on: twenty-five numbers per genome, issued by the independent Eurogenes service, inside which distances, mixture models and PCA plots all live. Because the coordinate is portable, an entire ecosystem of tools grew around it, and most confusion starts with what a coordinate is and is not.
These articles cover the whole G25 workflow: obtaining official coordinates from each testing platform, scaled versus unscaled rows, what a fit distance does and does not mean, how the nMonte tradition of mixture fitting works, and how to keep a model honest instead of merely small.
What Ancestry Map, our paid Global25 analysis, includesHave Global25 coordinates? Get a free G25 Admix report: admixture per era, closest populations, notable matches. Free once per account, nothing is published.

Every service that sells or offers a Global25 (G25) analysis in 2026, side by side: what each computes, whether the coordinates are official, whether the source panels are published, whether anyone builds a calculator around your own row, and the price model as each site states it, with the complete price ledger of the Global25 ecosystem.

The fit distance measures how far a mixture still sits from your coordinate — not whether the model is right. Calibrated bands for reading one, why lower stops being better, and the checks that actually validate a model.

Every Global25 row exists in two forms, and mixing them is the hobby's most common silent error. What scaling does mathematically, which form each tool expects, and the tell-tale signs of a mixed comparison.

Adding sources always lowers a G25 fit distance and routinely worsens the model — a worked demonstration where the fit improved from 0.0110 to 0.0068 while the story collapsed. The rules that keep a panel honest.

Global25 is a projection, not a test — so 'accuracy' has layers: the coordinate's own fidelity, the references it is compared against, and the models built on top. An honest audit of all three.

Ger Huijbregts's nMonte turned Global25 rows into ancestry percentages and founded a whole tool tradition. How the Monte-Carlo search works, what nMonte3 changed, what the fit distance is, and the discipline the script never enforces.

What a Global25 PCA projection shows, what the axes are and are not, why plot distance lies, the difference between projecting onto a fixed view and fitting your own — and the honest uses of both.

A Global25 model and a testing company's ethnicity estimate answer different questions with different references and different time depths. What each is actually computing, and which to trust for which claim.

Everything you can do with a Global25 row without paying anyone: distance rankings, admixture fits, PCA plots, averaging, authenticity checks — Vahaduo, nMonte and the Ancestrify Lab, honestly compared.

What a Global25 distance ranking actually measures, why era choice changes everything, how close is 'close', and the four misreadings that turn a good tool into a wrong conclusion.

From the Eurogenes blog's admixture calculators through Global 10 to the 2018 launch of Global25 — why a 25-dimension PCA became the ancestry community's common currency, and what changed around it since.

What Davidski's Eurogenes G25 Requests portal is, what you upload, the scaled and unscaled rows you get back, their stated fee, and what to do with the row next.

Global25 coordinates explained from scratch: what the 25 numbers are, where they come from, scaled versus unscaled, what you can compute from them, and the honest limits of a coordinate-based ancestry analysis.

A step-by-step Vahaduo tutorial: where to paste your Global25 coordinates, how the Distance, Single, Multi and PCA tabs work, how to build a source panel, and how to read a fit distance without over-reading it.

What a 23andMe or AncestryDNA ethnicity estimate measures, what an ancient-DNA ancestry test measures instead, why the two disagree by design, and how to run the second one on the raw file you already have.

Who the Western Steppe Herders were, how steppe ancestry spread across Europe and Asia after 3000 BC, what a 'steppe percentage' actually measures, and how to estimate yours with qpAdm or Global25 from a raw DNA file.

Who Europe's Mesolithic hunter-gatherers were — Western, Eastern and Caucasus — how their ancestry survived farming and the steppe migrations, and how to measure your hunter-gatherer share from a raw DNA file.

The first farmers of Anatolia spread across Europe from 6500 BC and are the largest ancestry component in most southern Europeans today. Who they were, what 'Early European Farmer' means in a calculator, typical shares by region, and how to measure yours from a raw DNA file.

Why a standard Global25 calculator can describe a population well and one person badly, how our analyst builds a calculator around your own coordinates for every Ancestry Map, and what your report shows you.

Notable Matches ranks your Global25 coordinates against 254 famous ancient individuals with published DNA: kings, mummies, warriors and Ice Age people. What a distance to one buried person means, and what it can never mean.

Global25 fits your coordinate to a mixture and always returns percentages. qpAdm tests a model against allele-frequency statistics and can reject it. A practical comparison of when each one is the right instrument.

What the 25 numbers mean, why scaled and unscaled forms must never be mixed, how a closest-population ranking is computed, what a fit distance does and does not tell you, and the failure modes that make confident results wrong.

Where Global25 coordinates come from, how to get them whether you tested with 23andMe, AncestryDNA, MyHeritage, FamilyTreeDNA, LivingDNA or a whole-genome sequencer, what every route costs, and how to tell a real coordinate row from a simulated one.
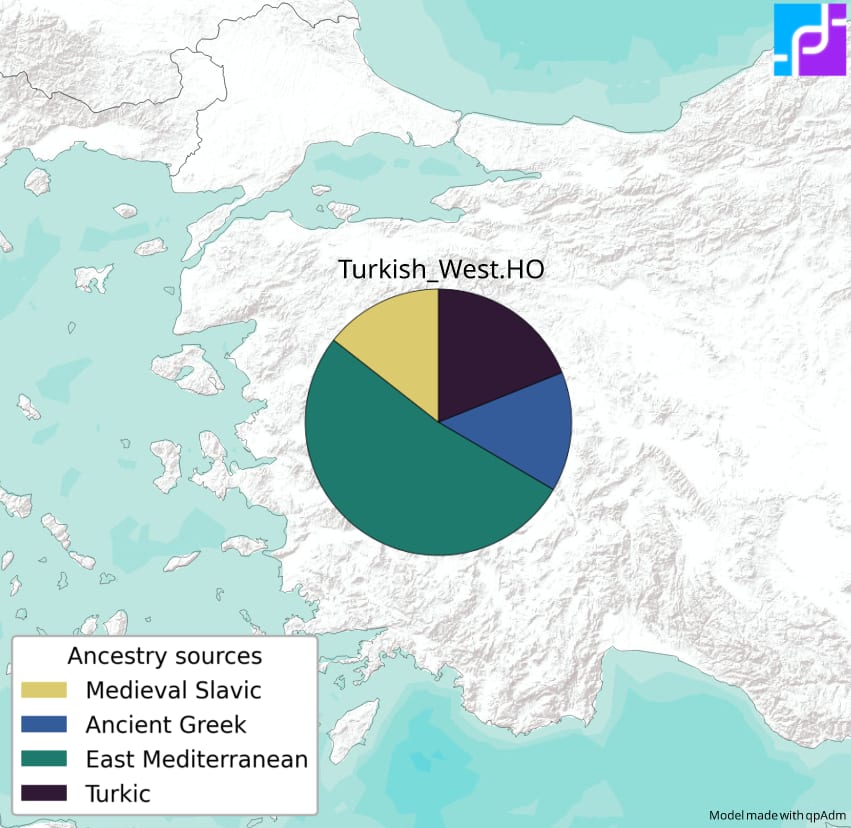
qpAdm modeling shows modern Anatolian Turks carrying ancestry from Neolithic farmers, Yamnaya, and later Iron Age to medieval populations, reflecting a complex mix of local and incoming ancestries.